Tickerplot 2.0
Posted on Sat 19 August 2017 in tickerplot
Background
Recently I wanted to revive one of my past projects - 'tickerplot'. 'tickerplot' was a simple (and very basic) front-end to a stock charting library, I had written back then. Being able to look at historical charts of a Stock and Index is cool, but there are many places where you can do that, so a simply re-creating the old site won't be of much of a value. Instead, it will be a good idea if one could shortlist a set of Stocks that one wants to take a closer look at based on certain criteria from historical prices, to be able to identify a viable investment opportunity. For example, I would want to answer questions like -
- How many 2X in a year opportunities were there in last 15 years?
- Which stocks are outperforming mainstream index like Nifty or a broad-based index like Nifty 500 over last quarter.
- Stocks that have 'unusual' weekly volume in the last week.
- Stocks that crossed their 50 weekly EMA from below.
An important feature goal is - A user should be able to ask questions of her choice, so we don't simply pre-compute and show the results that we think are important. One important design requirement is - answers to such questions should be available in few seconds at the most. A user won't find this particularly useful if we took minutes to answer these questions (which is not bad by the way - but not very user friendly). The idea being, once someone shortlists such stocks, based on her questions, one can take a closer look at those.
Concretely, this becomes a data aggregation, analysis problem and supporting infrastructure.
The Stack
Since I already had some code, I started simply porting that application from a rather old version of DJango for which it was written to newer one. But, soon it became apparent, most of the data I was working back then and utilities I had written don't work anymore. NSE has a habit of changing things randomly every few months. So it was time to take a fresh look at it.
So first it started as a bunch of scripts and few experiments.
First the data needs to be downloaded from available public sources. I didn't look at any of the services mainly because - back when I did it first time (a few years ago), these services were not available, or whatever was available had at-least one limitation, that you have to get from somewhere and typically from NSE site.
Since downloading data involves a bit of screen-scraping I decided to use requests and BeautifulSoup.
Often, you have to do a very basic pre-processing, so the data needs to be in some form of SQL tables (much easier). Initially, the code was littered with too man SQL statements across several files, which made maintainability significantly challenging. SQLAlchemy provides a very Pythonic way of dealing with SQL SQLAlchemy Core. In fact SQLAlchemy is known for it's ORM, but the ORM itself is built upon the Core.
Often the data is a time-series data and often we perform computations on the fly on data, so a support for time-series data and vector computations was an important feature in data-processing library. pandas, which is based on numpy is quite ideal for processing data of this volume (about 15 years of historical data of about 1500 stocks - roughly - about 1GB - using some back of the envelope calculations.).
Since, the analytics part should run asynchronously (see below). We need a work-queue where the analytics nodes will pick up work from queue and do the processing. In the past I had used celery, but instead of using celery - which has just too many dependencies, we are going to use a simple redis based queue called rq, it's simple abstraction is good enough for the job at hand. We don't have a very complicated work-flow, so a lot of celery features might be an over-kill. In fact one could simply develop this over custom SQL tables, but an abstraction of Queue is always a correct way to start.
Architecture
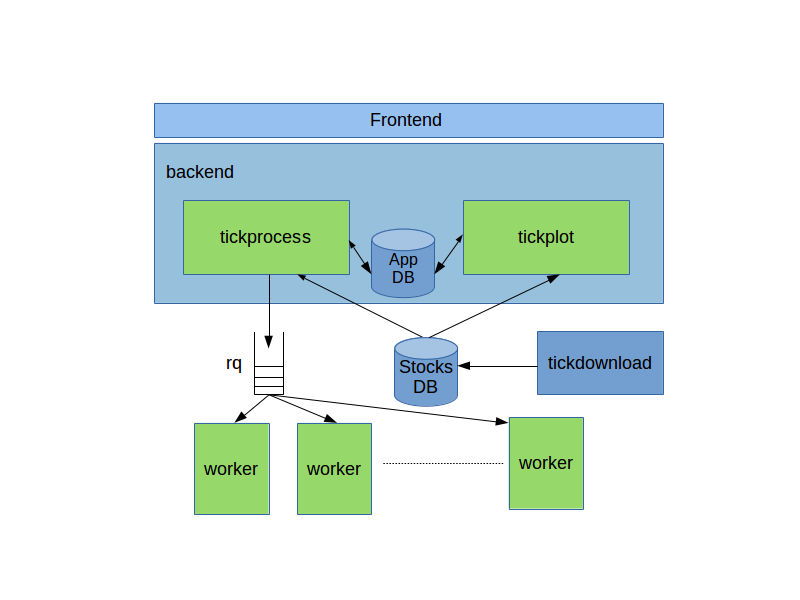
The Project is called 'tickerplot'. The project has the following main components in the following repositories.
- 'tickerplot' Web Application - Project in DJango speak - Repo tickerplot-site
- 'tickerplot' Python Package - This is mainly the code that will be shared by different applications inside 'tickerplot' - Repo tickerplot
- 'tickplot' - The tickerplot charting web application - Application in DJango speak - Repo tickerplot-site
- 'tickprocess' - The tickerplot analytics application - Application in DJango speak - Repo tickerplot-site
- 'tickdownload' - A collection of utilities for data acquisition, cleaning and pre-processing - Repo tickdownload
- 'tickprocess_worker' - The worker code for the analytics application - Repo tickprocess_worker
The way these applications interact is explained in the following figure -
 |
| Tickerplot Architecture |
Note: This is a Work In Progress, so the internal implementations of the above components are going to change considerably in the coming days, but broadly the above architecture will remain in-tact.